Sunday, September 15, 2013
Saturday, August 10, 2013
A Journey to D3 for Data Visualization and Journalism
Inspired by René Clausen Nielsen's blog, World of Data, I decide to put myself on a 8-week challenge of picking up D3. Here are a few tutorial, as suggested by René like
Scott Murray ,
Jeff Heer and Jérôme Cukier's.
The final exam for which I would be the only test taker and grader) would be writing a post. What's the exam about? Two options here:
1. I am currently reading Sheryl Sandberg's Lean In, where she cited many interesting research findings about women's employment situation in the contemporary world. Just pick up one.
2. I love movies, mystery, thriller and crime books. I believe there are much data out there but challenge is these kinds of business are never my domain knowledge. According to Paul Bradshaw's inverted pyramid of data journalism, the first and foundational step to make data talk is to compile the real data. Where can I ferret out those data? Plus, I need a hypothesis and massive amount of time for data mining.
Anyway, stop whining and make it happen. If you can become a chef in 4 hours, I believe I can become the new punk, the one Simon Rogers refers to in his TEDxTalk (as shown below).
P.S. I was hesitating if I should hit the "Publish" button or "Save" (so I don't need to showcase "I fail my challenge.") But now you know what I've chosen......... Here I go!
Wednesday, August 17, 2011

Saturday, August 6, 2011
News Pick- International Higher Education
Below is my pick from related education/higheredu/international edu. Check it out.
Thursday, July 14, 2011
Hand-Flip Quantitative Analysis? Mm...Maybe
Quantitative analysis looks intimating with those formulas, algebra, calculus....But after all, we still call it Applied Econometrics. That means it is still usable, doable and interpretable.
Recall one of my favourite professors said in class that suppose you get good-quality data( I mean it, really structured), running a model is just hand-flip thing. The crux is how you interpret the results, namely the beta coefficents, and how you are going to use it to change the status quo.
Notes on Feb. 2nd, 2013: Dabbleboard seems to shut down for good. So the flow chart below is no longer available.
Tuesday, July 12, 2011
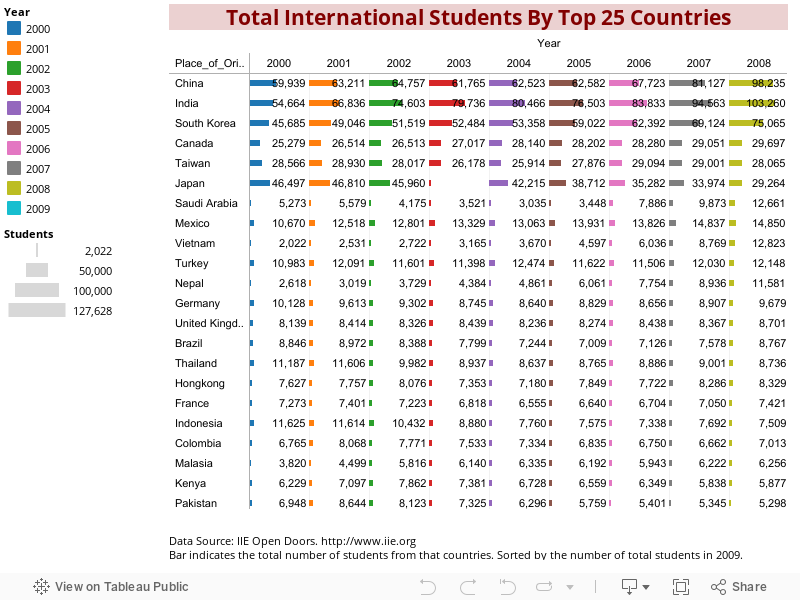
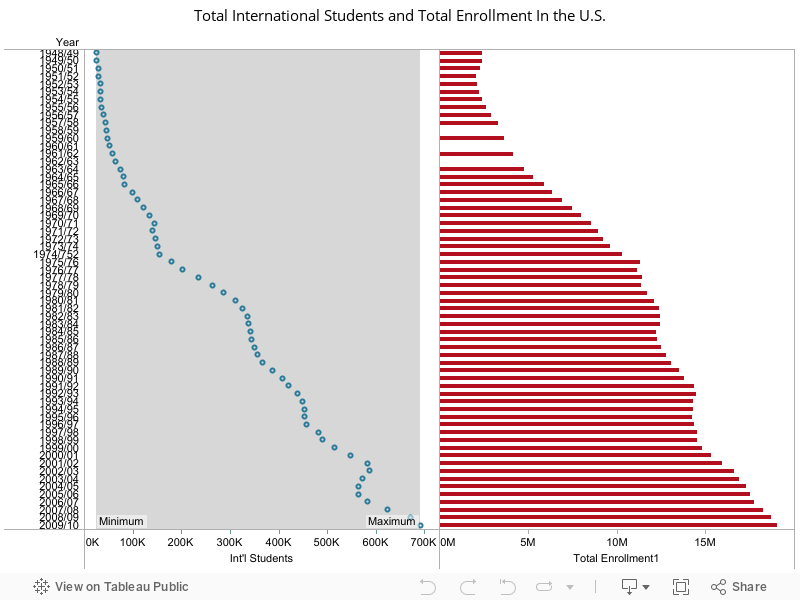
Let's See Who Are Those International Students In The U.S.? Data From 2000-2009
Click on the bar and see the number of international students of that country. Enjoy~
Sunday, July 10, 2011
Subscribe to:
Posts (Atom)